Learn More
Plugin showcase: Building a single pane of observability glass
Jun, 9 2021 at GrafanaCONline 2021
Plugins allow users to extend and customize their Grafana experience with their choice of data sources, dashboards, and apps. But what makes a good data source plugin? In this session, we’ll go over the key elements of popular and effective plugins; show how to use features such as alerts, annotations, and query caching; and demo some new and improved plugins available now.
Redis DevOps with Grafana
Jun, 4 2021 on Redis Channel
The Redis Grafana plugin gives you real-time insights for your Redis servers and Redis applications. In this video you'll see how Grafana displays a server's workload, how to use the Grafana command line widget to interact with your Redis server, and a custom dashboard built to monitor an application built on Redis.
Elevate your Redis experience with Redis plugins for Grafana
April 20-21, 2021 at RedisConf 2021
Redis Data Source and Application plugins enable users to connect to a Redis database and build dashboards in Grafana to easily observe Redis and application data. Elevate your Redis experience with custom dashboard panels that add Redis CLI, Latency Monitor, biggest keys, and other useful functionality.
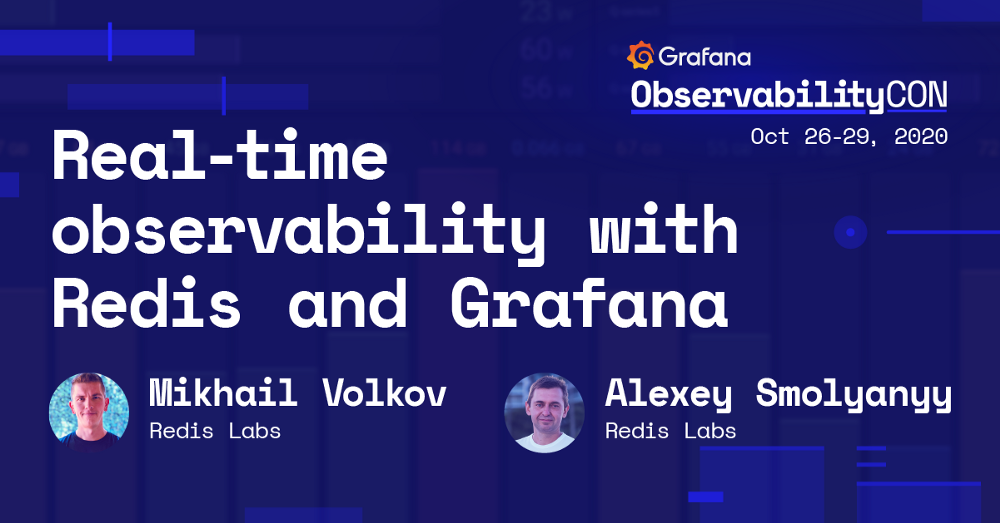
Real-time observability with Redis and Grafana
October 26, 2020 at ObservabilityCON
Do you want to learn how to combine Grafana streaming capabilities with interactivity to take Grafana beyond observability? In this session, you’ll learn about the integration of Grafana and Redis, the most loved in-memory database. We will present 3 real-life applications built with Redis Data Source for Grafana. Additionally, we’ll show you how to use the Redis Data Source and demonstrate the new Application plugin with custom panel and dashboards. Finally, we will touch on the new features of Grafana 7: data frames, transformations, and streaming.

